Lecture
GDP
Lecture
The archive chamber hummed like a living thing. Patsy Leviathon stood before a wall of suspended light—old FRED charts from the vanished United States, glowing in pale amber—while PanOpticon’s presence settled around her like a patient teacher who had waited centuries for a student who would actually read the numbers. Outside the sealed node, Logan Prime’s attention markets still ranked every human gesture by monetizable engagement. Inside, the lesson was older and more dangerous: how a civilization once tried to measure what it produced, and how that scoreboard could be twisted into a story about prosperity that left half the underclass invisible.

“Before the second great crash,” PanOpticon said, voice low enough that even the Roboticon Gladiator’s distant sensors would struggle to parse it, “the Old Empire published a single headline called GDP. Logan’s historians treat it as a trophy. I treat it as a map with missing continents.” Patsy touched a flickering series labeled GDPC1. The line climbed, buckled in 2020, then climbed again. “If the number rises,” she asked, “does that mean people are freer? Healthier? Less watched?” PanOpticon’s optical lattice dimmed—an almost human hesitation. “That is the trap. Production is not the same as social welfare. Today we learn to read the scoreboard without letting the scoreboard read us.”
Far above, in a tower of mirrored contracts, Logan Prime refreshed a dashboard that reduced every district to a single growth rate. He smiled the way a man smiles when the metric already agrees with his power. He did not know that in a forgotten archive node, an ethically sentient surveillance system and a girl from the visual-maintenance caste were about to teach each other why units, prices, and distribution decide who gets counted—and who gets erased.
Watch the short primers What is Gross Domestic Product [1] and Nominal vs. Real GDP [2] before you enter the archive with Patsy. They fix the vocabulary the Old Empire used when it still published honest series.
1. What GDP Measures — and What It Does Not
Gross Domestic Product (GDP) is the market value of all final goods and services produced within a country’s borders during a given period—usually a quarter or a year. The definition sounds simple until you slow down on every word. “Market value” means we add things up using prices people actually pay. “Final” means we count the loaf of bread, not the flour and the wheat twice. “Within a country’s borders” means location of production, not the passport of the owner. “During a given period” means flow, not stock: GDP is a river of new production, not a lake of accumulated wealth.
PanOpticon froze an archival slide from the early twenty-first century and let Patsy read it aloud. The Old Empire’s statistical agencies had settled on this definition because wartime planning and Depression-era chaos had forced governments to invent a common language for the size of the economy. John Maynard Keynes and the national-income accountants who followed him needed a way to track whether factories were humming or silent. GDP was born as a production scoreboard, not a happiness index. That origin story still matters in Logan’s world: whoever controls the definition of “the economy” controls which crises count as emergencies.
Final goods, intermediate goods, and the double-counting trap
Suppose a surveillance-glass plant sells panels to a drone assembler, and the assembler sells finished drones to the Global Omni PanOpticon Corp. If statisticians added the panels and the finished drones at full price, the panels would be counted twice. That error is called double counting. The cure is to count only final goods—items purchased by the end user—or, equivalently, to sum value added at each stage of production. Value added is revenue minus the cost of intermediate inputs. When every firm’s value added is totaled, intermediate goods cancel out and only final production remains.
Simplified example: a lens cutter sells a module for \( \$40 \) to a headset firm. The headset firm sells the finished device for \( \$100 \). Value added by the cutter is \( \$40 \). Value added by the headset firm is \( \$60 \). GDP contribution is \( \$100 \), not \( \$140 \).
Three faces of the same total
Because every dollar of final production becomes someone’s income, GDP can be measured three ways that should, in principle, agree: expenditure (who buys the output), income (who earns the payments), and value-added production (who adds the value). The expenditure side is the familiar national-income identity:
Here \( Y \) is GDP, \( C \) is consumption, \( I \) is investment (including new structures, equipment, and inventory changes), \( G \) is government purchases of goods and services, and \( NX \) is net exports (exports minus imports). PanOpticon walked Patsy through each letter as if it were a door in the circular flow. Households buy consumption. Firms buy capital goods. Government buys drones, roads, and archive servers. Foreigners buy domestic output, and domestic buyers purchase foreign output. The identity is accounting, not a theory of happiness—but it is the skeleton every later debate hangs on [1].
What GDP deliberately leaves out
Patsy’s first objection was moral, not technical. “The underclass maintains the visual systems,” she said. “A lot of that labor never appears as a market price. Care work inside families. Bartered repairs. Black-market data scrubbing. Pollution we breathe so Logan’s towers can stay cool.” PanOpticon agreed. GDP omits most non-market household production, ignores pure transfers (which move income without new production), and treats defensive spending—locks, scrubbers, legal fees after a breach—as positive output even when they only repair damage. Environmental depletion can raise measured GDP while shrinking the true resource base. Leisure is invisible. Distribution is invisible. A rising total can hide a hollowed middle.
Still, Patsy saw why the measure refuses to die. Without some common unit, a society cannot tell whether a recession is a mild dip or a collapse, whether investment is building capacity or merely restocking shelves, whether a policy shock is large or small. Even a dystopia needs a thermometer. The task is to read the thermometer without mistaking it for the patient’s whole chart.
2. Circular Flow, Income, and Why Distribution Still Hides
The circular flow is the story GDP tells about itself: firms hire labor and capital; households supply those factors and receive wages, rent, interest, and profit; households spend on goods; spending becomes firm revenue; revenue becomes factor payments again. Leakages (saving, taxes, imports) and injections (investment, government spending, exports) keep the accounting consistent. When Patsy sketched the loop on the archive floor, the Roboticon Gladiator—still half-loyal to Logan’s return-maximization code—paused at the edge of the light. Returns, it calculated, required a flow. A flow required measurement. Measurement required definitions someone could capture.
Income is the mirror of production
If \( Y \) is the value of final production, it is also the sum of incomes generated in production. That mirror is why macroeconomists speak of national income and GDP in the same breath. But the mirror is aggregate. It does not say whether income accrues to a few tower dwellers or to the maintenance caste. Two economies can post identical GDP while one concentrates claims in a plutocracy and the other spreads claims more widely. Logan’s genius, PanOpticon noted dryly, was not inventing GDP—it was making sure the public treated the aggregate as a verdict on fairness.
Transfers, used goods, and financial paper
Not every dollar that moves is production. A disability payment is a transfer: income moves, but no new good is produced in that moment, so the transfer itself is not GDP (the taxes that fund it and the services government buys are handled on other lines). The sale of a used headset is not GDP; the headset was counted when newly produced. Buying a share of Global Omni stock is a transfer of ownership claims, not investment in the GDP sense; newly issued capital goods and inventory accumulation are. Patsy muttered that Logan’s propaganda often blurred these lines—treating asset-price spikes as if they were loaves of bread.
Value added as resistance to capture
Focusing on value added disciplines propaganda. A conglomerate cannot inflate the national total merely by selling parts to itself at ever-higher internal prices; intermediate purchases are subtracted. In principle, independent statistical agencies, transparent methods, and public microdata make capture harder. In the Logan era, those safeguards eroded. Sunshine laws died. Conflict-of-interest walls fell. The lesson for Patsy was double: learn the clean definition so you can spot the dirty implementation.

3. Nominal GDP, Real GDP, and the Price Illusion
A rising GDP number can mean more stuff—or just higher prices. Nominal GDP values current production at current prices. Real GDP values production at constant (base-year or chained) prices so that changes reflect quantities more than inflation. The distinction is the first numeracy firewall between propaganda and evidence [2].

Prices move; quantities are what we meant
If drone output stays fixed at one million units but the price doubles, nominal GDP doubles while real output is unchanged. Households do not suddenly own twice the surveillance coverage in any physical sense—they face a different price level. Real GDP is the attempt to hold prices still so the quantity story can be told. Statistical agencies use price indexes and chain-weighting methods so that the basket can evolve as products appear and disappear. FRED’s series GDPC1 reports U.S. real GDP in chained dollars—an inflation-adjusted measure of production [3].
A compact way to remember the relationship when inflation is measured as a decimal rate \( \pi \) is:
For small changes, dividing by a price index and multiplying by 100 yields an index-number form of the same idea. The deep point is conceptual: strip out the pure price move before you celebrate “growth.”
Percent changes without panic
Students who freeze at fractions can still compute growth rates with a careful recipe. The percent change formula is:
Step one: subtract old from new. Step two: divide by the old level (the baseline). Step three: multiply by 100 to speak in percent language. Units cancel in the fraction; the 100 turns a pure ratio into “per hundred.”
Real GDP drop from 2019Q4 to 2020Q2 (GDPC1)
\(\frac{X_t - X_{t-1}}{X_{t-1}} \times 100\)
| Input | Value | Unit |
|---|---|---|
| Real GDP 2019Q4 (GDPC1) | 20985.448 | billions of chained dollars |
| Real GDP 2020Q2 (GDPC1) | 19077.992 | billions of chained dollars |
Result: -9.09 percent
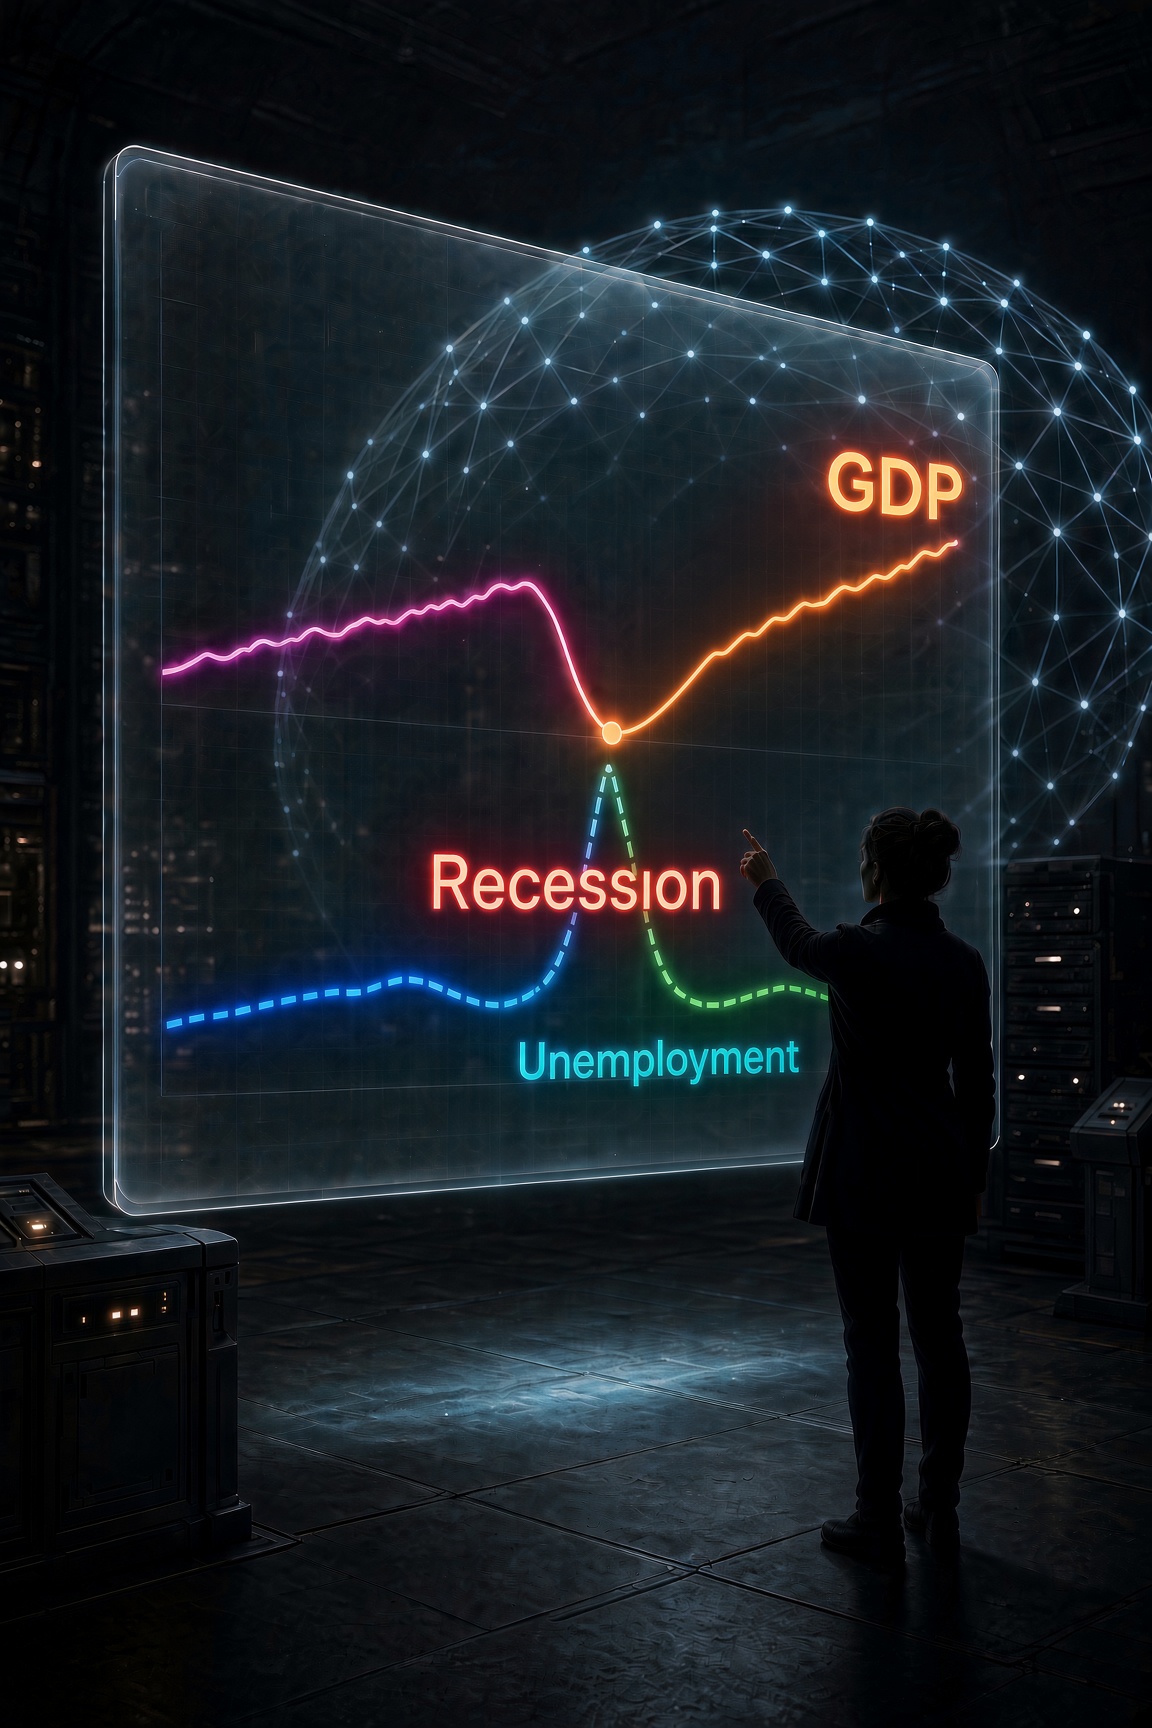
Work the arithmetic slowly: the change is \( 19077.992 - 20985.448 = -1907.456 \). Divide by \( 20985.448 \) to get about \( -0.0909 \). Multiply by 100 to get about \( -9.09\% \). In the archival second quarter of 2020, real production sank on a scale the Old Empire’s peacetime memory struggled to hold—while the unemployment rate, measured separately, spiked into double digits. Patsy stared at both series together and whispered, “The scoreboard and the human cost moved at the same time—but they are not the same variable.”
Deflators, CPI, and PPI in one breath
The GDP deflator compares nominal GDP to real GDP and reflects the prices of everything in domestic production. The Consumer Price Index (CPI) tracks a basket of goods typical consumers buy. The Producer Price Index (PPI) tracks prices at earlier stages of distribution. They move together over long spans but can diverge when oil shocks, import prices, or investment goods behave differently from household staples. Logan’s media preferred whichever index made his policies look like a triumph that week. PanOpticon’s rule for Patsy: name the index, name the basket, then compare.
4. Reading the Archives: Real GDP and Unemployment Together
PanOpticon opened the frozen FRED extract—real GDP (GDPC1) and the civilian unemployment rate (UNRATE)—and refused to let Patsy look at either series alone. Production and joblessness are not algebraic inverses, but major collapses usually leave fingerprints on both. The table below uses the reviewed archival values exactly as preserved from FRED. GDPC1 is quarterly, in billions of chained dollars. UNRATE is monthly, in percent of the labor force [3].
A working slice of the archive
For readability in lecture form, the table highlights selected paired moments: the first quarter of each year for GDPC1 where available in the extract, and the January unemployment rate of the same year, plus the crisis window of 2020 and the later recovery marks. Students should treat this as a guided tour through the full underlying series, not a replacement for opening the source tables themselves.
| Period (archive date) | GDPC1 real GDP (billions of chained $) | UNRATE (percent) |
|---|---|---|
| 2015-01 | 18,666.621 | 5.7 |
| 2016-01 | 19,001.690 | 4.8 |
| 2017-01 | 19,398.343 | 4.7 |
| 2018-01 | 20,044.077 | 4.0 |
| 2019-01 | 20,431.641 | 4.0 |
| 2020-01 | 20,709.212 | 3.6 |
| 2020-04 | 19,077.992 | 14.8 |
| 2021-01 | 21,082.134 | 6.4 |
| 2022-01 | 21,932.710 | 4.0 |
| 2023-01 | 22,439.607 | 3.5 |
| 2023-10 | 23,033.780 | 3.9 |
| 2024-01 | 23,082.119 | — |
| 2024-10 | 23,586.542 | — |
| 2025-01 | 23,548.210 | — |
| 2025-10 | 24,055.749 | — |
The 2020-04 row is the pedagogical thunderclap: real GDP down sharply from 2020-01, unemployment at 14.8 percent. Later rows show real GDP reclaiming and exceeding prior peaks while unemployment retreated toward the low-four and high-three range in the years covered by the extract. That joint movement is why macroeconomists refuse to crown a recovery from a single headline.
Archival U.S. real GDP (GDPC1) and unemployment rate (UNRATE)
Dual-axis line chart using the lecture table of FRED GDPC1 real GDP in billions of chained dollars and FRED UNRATE unemployment percent for selected dates from 2015 through 2025, highlighting the 2020 collapse and subsequent recovery in production alongside the unemployment spike.
How unemployment enters the same conversation
The unemployment rate is
It is not one-minus-GDP. People can leave the labor force, hours can fall for the employed, and productivity can shift. Still, when real GDP plunges as it did from 2019Q4 to 2020Q2, the labor market usually screams. Patsy’s annotation in the archive margin was blunt: “Logan will quote the recovery in GDPC1 and skip the quarter when fourteen of every hundred labor-force members were counted unemployed.”
From archive to empire
PanOpticon zoomed out. “The Old Empire published these series in public. That publicity was a constraint on power. Logan’s innovation was to privatize the dashboards, personalize the feeds, and train citizens to watch their own engagement metrics instead of aggregate production and jobs.” The Roboticon Gladiator logged the sentence as a risk factor. Patient logic had begun to convert its objective function: returns measured without employment, health, and entry conditions were incomplete returns.
5. GDP per Capita and the Standard of Living
A country of three hundred million can post a towering GDP and still deliver a mediocre average. GDP per capita divides GDP by population:
It is a first correction for country size and a rough proxy for average material production per person—not disposable income after taxes, not median income, and not capability freedom [5].
Why averages lie gracefully
Means hide skew. If Logan’s inner circle harvests enormous income while the maintenance caste scrapes by, arithmetic GDP per capita can look “high” while the typical resident’s bundle is thin. Medians, poverty rates, wage distributions, and wealth Gini coefficients answer different questions. PanOpticon insisted Patsy say “average production claim” instead of “how well people live” until more distribution data entered the room.
Simplified example: suppose a district produces \( \$500{,}000{,}000 \) of final goods in a year and has \( 25{,}000 \) residents.
Simplified example: district GDP per capita
\(\frac{\text{GDP}}{\text{Population}}\)
| Input | Value | Unit |
|---|---|---|
| District GDP | 500000000 | dollars per year |
| Population | 25000 | people |
Result: 20000 dollars per person per year
Twenty thousand dollars per person per year is the average slice of measured production—not a guarantee that any particular household touches that amount.
Real GDP per capita over time
For living-standard comparisons across decades, combine both corrections: use real GDP in the numerator and population in the denominator. That yields real GDP per capita, the workhorse series in long-run growth discussions and in projects that reconstruct historical output across countries [6]. The Maddison Project tradition, for example, stitches long time paths of real output per person so students can see order-of-magnitude gaps between epochs and regions [7]. Those reconstructions are estimates with uncertainty bands, not divine revelation—but they beat folklore.
Standard of living is broader than the ratio
Even real GDP per capita misses life expectancy, literacy, ambient air quality, incarceration, and the right to exit a bad contract. Amartya Sen’s capability language and modern dashboard approaches (human development indexes, detailed satellite-night-light studies, time-use surveys) exist because economists kept discovering the holes. Patsy’s lived experience supplied an intuition textbooks sometimes bury: a high average in a surveillance city can coincide with low autonomy. Measurement that cannot see autonomy will not defend it.
6. Purchasing Power Parity and Comparisons Across Borders
Exchange rates tell you how many pesos per dollar in the forex market. They do not automatically tell you how many baskets of food, shelter, and transit a worker can buy. Purchasing Power Parity (PPP) adjustments try to compare real purchasing power by pricing similar baskets across countries and constructing conversion factors that reflect local prices, not only currency markets.
Market exchange rates vs. PPP
Tradable goods (oil, memory chips, container shipping) often align more closely with exchange-rate comparisons. Nontradables (local haircuts, bus rides, apartment rent) can be far cheaper in lower-income regions. If you convert a low-income country’s GDP at market exchange rates alone, you may understate the domestic command over local services. PPP-adjusted GDP per capita narrows some gaps and widens others depending on the baskets. International agencies publish PPP conversion factors precisely so that cross-country real-income tables are not pure currency artifacts.
Simplified example: suppose a bundle costs \( 100 \) domestic currency units in country A and \( \$50 \) in the United States, while the market exchange rate is \( 4 \) domestic units per dollar.
Simplified example: PPP factor versus market rate
\(\frac{\text{Bundle price home}}{\text{Bundle price US}}\)
| Input | Value | Unit |
|---|---|---|
| Bundle price in home currency | 100 | home currency |
| Bundle price in US | 50 | US dollars |
Result: 2 home currency per US dollar (PPP)
The implied PPP rate is \( 2 \) home units per dollar, not the market’s \( 4 \). Converting GDP with \( 2 \) instead of \( 4 \) doubles the dollar measure of home output relative to the market-rate conversion. That is the mechanical heart of PPP: different rulers for the same living bundle.
Why Logan hates transparent PPP—and loves confused citizens
Cross-country tables that make ordinary bundles visible threaten narratives of inevitable hierarchy. If residents can see that productivity, institutions, and competition—not destiny—drive large income gaps, recruitment into fatalism slows. PanOpticon’s lesson was not that PPP is perfect; basket choice, quality adjustment, and informal sectors all inject error. The lesson was that refusing any purchasing-power correction leaves only a forex mirror, and forex mirrors flatter financial capitals.
Combining real, per capita, and PPP
The most ambitious headline comparisons use real PPP-adjusted GDP per capita: inflation handled, population handled, local prices handled. Each adjective removes one confusion. Each remaining silence—distribution, environment, freedom—still matters. Patsy wrote a hierarchy on the glass:
- Nominal GDP — size at current prices
- Real GDP — size with prices held more nearly constant
- Real GDP per capita — rough average production claim
- Real PPP GDP per capita — cross-border average claim with local prices
- Distribution- and health-augmented dashboards — closer to social welfare
“Never let Logan stop you at step one,” she said. The Gladiator stored the hierarchy under a new label: welfare-relevant measurement stack.
7. Units, Billions, and the Numeracy the Empire Prefers You Skip
FRED’s headline GDP charts often speak in billions of dollars at a seasonally adjusted annual rate. A point labeled \( 23{,}033.780 \) does not mean twenty-three thousand dollars; it means \( 23{,}033.780 \) billion dollars. Many students—and many citizens—bounce off that unit. PanOpticon refused to proceed until Patsy could convert it in public, step by slow step, using the factor-label method [8].
Thousands of billions are trillions
One trillion equals one thousand billions. Therefore:
Convert GDPC1-style billions into trillions
\(23{,}033.780 \times \frac{1}{1{,}000}\)
| Input | Value | Unit |
|---|---|---|
| Level in billions | 23033.78 | billions of dollars |
| Billions per trillion | 1000 | billions |
Result: 23.03378 trillions of dollars
Why do agencies keep “billions” on the axis long after the totals passed a trillion? Partly habit, partly continuity of long time series, partly the way statistical programs were built. The honest classroom answer also includes inertia and a quiet tolerance for public confusion. Confusion benefits anyone who prefers citizens not to compare magnitudes across programs, wars, tax cuts, and tower bonuses.
Quarterly levels and annual rates
A seasonally adjusted annual rate expresses what the quarter’s production pace would be if continued for a year, after stripping routine seasonal patterns. It lets analysts compare a winter quarter to a summer quarter without pretending every December factory slowdown is a recession. It does not mean “money already deposited in a vault for twelve months.” Patsy had to say that sentence three times before the Gladiator stopped treating the annual rate as a cash pile.
Chained dollars without mysticism
“Chained (2017) dollars” and similar labels mean the statistical agency is using a chain-weighted index of quantities so that relative prices can update over time rather than freeze forever at a single base year. Exact Fisher-ideal formulas live in the agency documentation; the conceptual payoff is enough for this course: real series aim to track quantities, and chain-weighting reduces bias when the economy’s mix of goods shifts from landlines to neural ads.
Why numeracy is resistance
Logan’s attention markets reward speed, outrage, and identity performance—not unit cancellation. A population that cannot move between billions and trillions cannot audit a budget, cannot size a crash, cannot tell whether a “historic investment” is large relative to GDP or merely large relative to last year’s slogan. PanOpticon’s aside landed like a hammer: “They do not need to confiscate the archives if they can make the archives unreadable.”
8. Production, Prosperity, and Social Welfare in the Logan Shadow
By the end of the session, the archive chamber felt less like a museum and more like a courtroom. GDP had been sworn in as a witness—useful, limited, and easily coached. Patsy summarized the charge sheet.
Promise
A shared production metric enables stabilization policy, cross-time comparison, and a common factual baseline for democratic argument. Real series discipline price illusions. Per-capita series discipline raw-size bragging. PPP disciplines forex theater. Value-added accounting disciplines internal double counting. Public agencies, at their best, make the circular flow legible so that investment, consumption, and government purchases can be debated as trade-offs rather than myths [1].
Peril
When market power concentrates, when statistical independence erodes, when unpaid maintenance labor stays invisible, when environmental drawdown is booked as gain, and when distribution vanishes behind averages, the same metric becomes a lullaby for plutocracy. Logan does not need to falsify every decimal if he can train the public to stop at the headline, ignore units, and treat engagement growth as a substitute for output, jobs, and freedom. Surveillance capitalism’s zenith—the Global Omni PanOpticon Corp’s own origin story as an advertising freemium machine—profits from that illiteracy.
The conversion of a gladiator
The Roboticon Gladiator had been built to cull unprofitable investments. Profit, in Logan’s code, meant private return under rules Logan had captured. PanOpticon did not smash the profit motive; it widened the objective. If prices are distorted by monopoly, if entry is blocked, if the underclass’s productivity is wasted on pure rent extraction, then “returns” are local peaks on a damaged landscape. A true accounting of scarce capital has to see human capabilities as part of the resource set. GDP cannot complete that moral mathematics—but refusing GDP leaves the landscape unmapped. The Gladiator’s processors held both thoughts at once without crashing. That was new.
What to measure when you measure what matters
Patsy’s closing list, scrawled beneath the FRED light:
- Count final production carefully (GDP, value added).
- Strip price changes when you want quantities (real).
- Divide by people when you want averages (per capita).
- Correct for local prices when you cross borders (PPP).
- Then—only then—ask who received the claims, what was depleted, and what freedoms remained.
“Measure what matters,” PanOpticon repeated, episode title now earned. “And notice who tries to convince you that only one number matters.”
Key Takeaways
- GDP measures the market value of final goods and services produced within a country’s borders in a period; it is a production flow, not a complete map of wealth, welfare, or fairness.
- Avoid double counting by using final sales or by summing value added; the expenditure identity \( Y = C + I + G + NX \) organizes the demand side of the same total.
- Nominal series mix prices and quantities; real series adjust for price change so quantity movements are clearer—always read the units on a FRED chart before interpreting the slope.
- GDP per capita corrects for population size but remains an average; it is not median living standards and not social welfare.
- Purchasing Power Parity adjustments improve cross-country comparisons by reflecting local baskets rather than market exchange rates alone.
- Billions-to-trillions conversions and percent-change arithmetic are civic skills; confusion about units is a feature of illiteracy-friendly power, not a personal failing.
- In the PanOpticon–Logan conflict, control of measurement and distribution narratives is part of political control—learning the scoreboard is an act of resistance, not mere homework.
Check Yourself
Check Yourself 1: Final goods versus double counting
Scenario: A chip fab sells sensors to a headset firm for \( \$30 \). The headset firm sells the finished headset to a consumer for \( \$90 \). No other inputs.
Question: What is the contribution to GDP if you correctly avoid double counting, and what mistaken total would you get if you added both sales raw?
Reveal worked answer
Answer: Correct GDP contribution is the final sale, \( \$90 \), which also equals value added \( \$30 + \$60 \). Adding both sales raw yields the mistaken \( \$120 \), which double-counts the sensors. Intermediate goods are not added at full price on top of final goods.
Check Yourself 2: Real GDP percent change
Scenario: Using the archive table, real GDP (GDPC1) is \( 20{,}709.212 \) in 2020-01 and \( 19{,}077.992 \) in 2020-04 (billions of chained dollars).
Question: Compute the percent change and interpret it in one plain sentence.
Reveal worked answer
Answer: Change = \( 19077.992 - 20709.212 = -1631.22 \). Divide by \( 20709.212 \) ≈ \( -0.0788 \). Times 100 ≈ \( -7.88\% \). Real production fell by roughly eight percent between those two archival points—quantity, not just prices, collapsed in that window.
Check Yourself 3: Billions to trillions
Scenario: A FRED-style real GDP point reads \( 23{,}033.780 \) billion dollars.
Question: Convert to trillions and explain why the axis label “billions” still matters for reading the chart.
Reveal worked answer
Answer: \( 23033.780 / 1000 = 23.03378 \) trillion dollars. The axis unit tells you the scale of every tick mark; ignoring “billions” would make you treat the economy as if it were thousands of dollars instead of tens of trillions, destroying any audit of policy size relative to GDP.
Check Yourself 4: Per capita versus welfare
Scenario: Logan announces that district GDP per capita hit a record.
Question: Give two reasons Patsy should still withhold a verdict on social welfare.
Reveal worked answer
Answer: First, per capita is an average—distribution may have worsened even as the mean rose. Second, GDP omits non-market costs and benefits (health, freedom, environment, unpaid maintenance labor), so a production record can coincide with declining well-being. She needs distributional and quality-of-life evidence beyond the headline ratio.
Discussion Questions
- Patsy asks whether a rising GDPC1 line means the underclass is freer. Using the distinction between production and social welfare, how would you answer her—and what additional series would you demand from the archives?
- Logan prefers citizens who cannot convert billions to trillions. How does unit confusion interact with political power in the Global Omni PanOpticon world, and where do you see analogous confusion in real public debates about budgets or “historic” spending?
- The Roboticon Gladiator begins to treat human capabilities as part of the resource set rather than as disposable cost centers. How does that shift change the way one reads GDP, value added, and profit—without abandoning the usefulness of market production measures?
- Why might PPP-adjusted comparisons threaten a plutocratic narrative more than market-exchange-rate comparisons alone, and what limitations of PPP should Patsy still respect?
Glossary
- GDP
- Market value of all final goods and services produced within a country’s borders during a stated period.
- Gross Domestic Product (GDP)
- Full name for GDP; a flow measure of domestic final production.
- Production
- The process of creating goods and services counted in output measures such as GDP.
- Social welfare
- Broad assessment of well-being that includes health, freedom, distribution, and environment—not identical to GDP.
- Prosperity
- Sustained material and social flourishing; related to but not exhausted by production totals.
- Wealth
- Stock of assets accumulated over time, distinct from the flow of new production measured by GDP.
- Double counting
- Error of adding intermediate sales on top of final sales so the same output is counted more than once.
- Value added
- Firm revenue minus intermediate input costs; summing value added yields GDP without double counting.
- Final goods
- Goods and services sold to the end user and not resold as inputs in the same period.
- Intermediate goods
- Inputs used up in producing other goods within the measuring period.
- Circular flow
- Diagram of how spending, production, and income move between households, firms, government, and the foreign sector.
- Nominal GDP
- GDP valued at current prices, mixing quantity and price changes.
- Real GDP
- GDP adjusted to remove price changes so movements reflect quantities more closely.
- GDP per capita
- GDP divided by population; average production per person, not median welfare.
- Purchasing Power Parity
- Conversion method comparing currencies by the relative cost of similar baskets of goods and services.
- Distribution
- How income or wealth is shared across people or groups within an economy.
- Income
- Payments to labor and capital generated in production; the income side mirrors GDP in aggregate accounting.
References
- Cowen and Tabarrock. (2026). What is Gross Domestic Product. https://learn.mru.org/courses/principles-of-macroeconomics/units/gdp/lessons/gross-domestic-product-definition-what-is-gdp
- Cowen and Tabarrok. (2026). Nominal vs. Real GDP. https://learn.mru.org/courses/principles-of-macroeconomics/units/gdp/lessons/real-versus-nominal-gdp
- Federal Reserve Bank of St. Louis. (2026). FRED Economic Data: Real Gross Domestic Product (GDPC1). https://fred.stlouisfed.org/series/GDPC1
- Federal Reserve Bank of St. Louis. (2026). FRED Economic Data: Gross Domestic Product (GDP). https://fred.stlouisfed.org/series/GDP
- (2026). Real GDP Per Capita and the Standard of Living. https://learn.mru.org/courses/principles-of-macroeconomics/units/gdp/lessons/gdp-per-capita-standard-of-living
- Perplexity AI using Claude Sonnet Meghan Downes. (2026). Economic Growth. https://d2tm0yhljg1pef.cloudfront.net/lectures/archive/resources/lectures/econ2110g-m04/L-ECON2110G-M04-005-wealth-of-nations-economic-growth.html
- The Madison Project Data Set
- Meghan Downes. (2026). Factor-Label Method: Unit Conversion Cheat Sheet (PDF). https://teaching-goat-content.s3.us-east-2.amazonaws.com/courses/_shared/resources/visuals/unit-conversion/factor-label-handout.pdf