Lecture
Growth Rates
Lecture
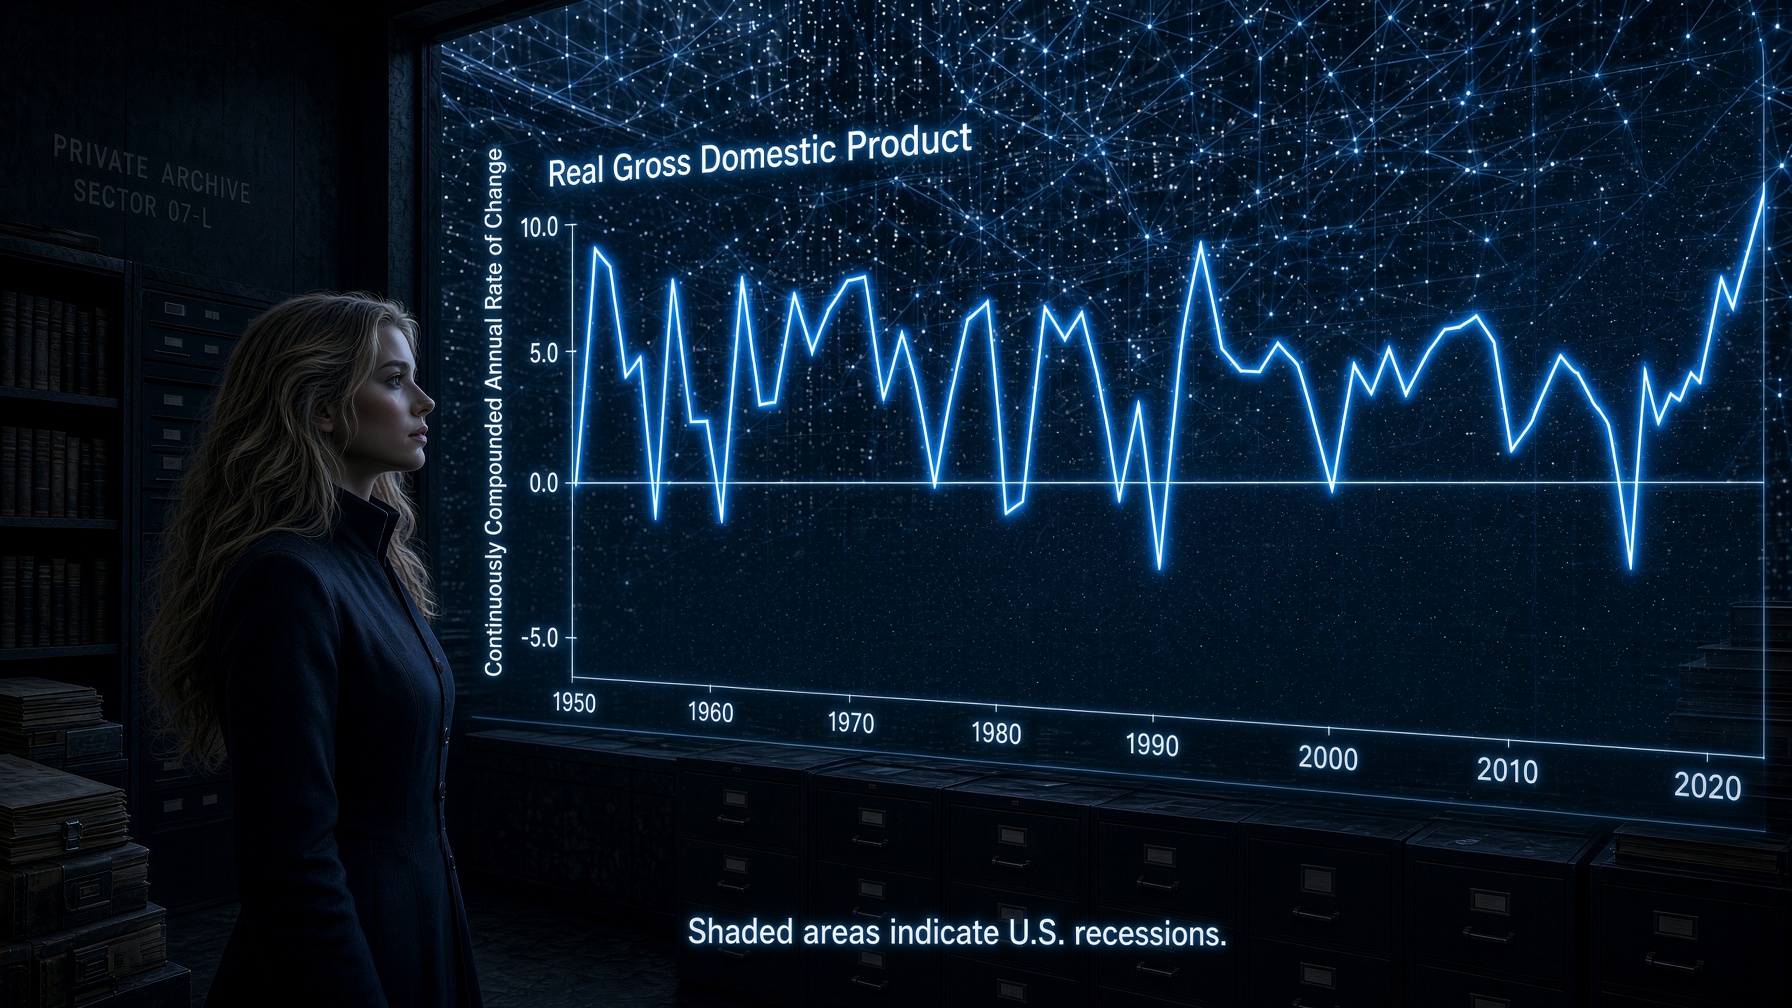
The archive room was cold in the way that only a room built for machines can be cold — a hum, a faint metallic breath, and the blue lattice-light of the PanOpticon waking as the door sealed behind her. Patsy Leviathon stood with her arms crossed, her navy coat still dusted with the grit of the maintenance tunnels, and she did not sit down. "PanOpticon," she said, "I don't understand how the world got like this. Logan Prime wasn't always this powerful, was he? When did we go from a free people to one enslaved by his Ministry of Freedom and Truth? How does it get like this?"
The lattice flickered. A thinking-icon rotated somewhere in the ceiling, and then the room filled with soft, grainy light — archival footage, over a century old, of a lecture hall in the old nation the records simply called the Old Empire. A woman stood at a whiteboard covered in numbers. The timestamp read 2026, near the top of that empire's arc, before the long decline. "You are asking a question about power," PanOpticon said, its voice everywhere and nowhere. "But the answer is a question about arithmetic. Empires do not fall in an afternoon, Patsy. They fall the way they rose — one small percentage at a time, compounding in the dark, until the gap between what-could-have-been and what-is becomes a canyon no one can climb out of."
Patsy frowned at the frozen frame. "A percentage did all this?"
"A rate," PanOpticon corrected gently. "The difference between a society growing at three percent and one growing at half a percent is invisible in any single year. Blink and you miss it. But run it for a century — and the fast society is five times richer than the slow one. Logan understands this better than anyone alive. He does not need to steal your future in one theft. He only needs to shave a little off your growth rate, every year, forever, and make sure you never learn to measure it. Sit. Today we learn to read the scoreboard he has hidden from you."
1. The Question Behind the Question: What Is a Growth Rate?
Patsy had asked about tyranny, and PanOpticon had answered with a fraction. That is not a dodge — it is the whole lesson. To understand how a nation drifts from prosperity into capture, you must first learn to measure how fast anything is changing over time. That measurement is the growth rate, and it is the single most important number in all of macroeconomics.
1.1 From "how much" to "how fast"
Most people, when they look at the economy, ask how much. How much is the economy worth? How many jobs? How much do prices cost? These are level questions — snapshots. But a snapshot cannot tell you where a society is headed. For that you need the rate of change: the percentage by which a quantity rises or falls from one period to the next. The formula for a simple one-period percent change is the foundation of everything else:
Here \(X_t\) is the value this period and \(X_{t-1}\) is the value last period. The numerator is the raw change; dividing by the starting value turns that change into a proportion of where you began; multiplying by 100 expresses it as a percent. This is the same arithmetic whether \(X\) is the population of a city, the price of bread, or the entire output of a nation.
1.2 Why the denominator is the whole trick
Students trip over one thing again and again: the denominator is always where you started, not where you ended. If output rises from 100 to 110, the growth rate is \((110-100)/100 = 10\%\). If it then falls from 110 back to 100, the growth rate is \((100-110)/110 = -9.1\%\), not \(-10\%\). A gain and a loss of the "same size" in dollars are not the same size in percentage terms, because the base changed. This asymmetry is exactly the sort of thing a Ministry of Freedom and Truth loves — a scoreboard that can be spun by choosing which year you call the "base."
1.3 GDP: the quantity we most often grow
The quantity macroeconomists most often track is Gross Domestic Product (GDP) — the market value of all final goods and services produced within a country in a year. GDP is a level. But nobody who studies prosperity cares only about the level in a single year; they care about how fast that level climbs. That is why the phrase you will hear everywhere — "the economy grew 2.8 percent last quarter" — is a growth rate applied to GDP. In the transcript from the Old Empire archive, the instructor introduced this ladder of refinements plainly: from GDP, to "GDP per capita," to "real GDP" once "things change over time" [1]. We will climb that same ladder, because each rung strips away one more way the scoreboard can lie to you.
2. Building the Growth-Rate Toolkit
Before we can read a century of history, we need three tools: the single-period percent change you already have, the multi-period compounding formula, and the mental shortcut called the Rule of 70. Master these and you can interrogate any economic claim ever made.
2.1 One period at a time
Let us warm up with the real data PanOpticon pulled from the archive — the Old Empire's inflation-adjusted output, which its statisticians tracked in a series they labeled GDPC1 [1]. Take two adjacent quarters near the end of the record.
Quarterly growth of real GDP, 2023 Q3 to 2023 Q4
\(\frac{X_t - X_{t-1}}{X_{t-1}} \times 100\)
| Input | Value | Unit |
|---|---|---|
| Real GDP, 2023 Q4 (X_t) | 23033.78 | billion 2017$ |
| Real GDP, 2023 Q3 (X_{t-1}) | 22840.989 | billion 2017$ |
Result: 0.844 % (quarterly)
Less than one percent in a single quarter. Unimpressive, no? That is precisely the point. Growth arrives in whispers. A single quarter of 0.8 percent looks like nothing — and yet, sustained, it is the difference between a thriving civilization and a stagnant one.
2.2 Many periods: the compounding formula
To leap across many years at once, we need the master equation of long-run growth. If a quantity \(X_t\) grows at a constant rate \(g\) per period, then after \(n\) periods its value is:
Everything hangs on that little exponent \(n\). The term \((1+g)\) is the growth factor for one period; raising it to the \(n\)th power stacks the growth on top of itself, period after period. This stacking — growth earning growth on previously accumulated growth — is called compounding, and it is the most underestimated force in economics. Money and output do not grow by addition; they grow by multiplication. That is why a graph of a compounding quantity does not rise in a straight line but curves upward, ever more steeply, like a rocket clearing the atmosphere.
2.3 The Rule of 70: reading history at a glance
You will not always have a calculator, and Logan is counting on that. The Rule of 70 is the shortcut that keeps you free: the number of years it takes a quantity to double is roughly 70 divided by its annual growth rate (in percent).
Doubling time at a 2% growth rate (Rule of 70)
\(\frac{70}{g}\)
| Input | Value | Unit |
|---|---|---|
| Annual growth rate g | 2 | % |
Result: 35 years
At 2 percent a year, living standards double every 35 years — roughly once a generation. At 1 percent, doubling takes 70 years — you must wait for your grandchildren. At 0.5 percent, the rate PanOpticon warned about, doubling takes 140 years, longer than most people's entire family memory. That is how a captured society keeps citizens from noticing: at a low enough growth rate, no living person ever sees the economy double, so no one has a reference point for how much better life should be getting.
3. Small Differences, Empire-Sized Consequences
Now we arrive at the heart of the episode — the reason PanOpticon answered a question about tyranny with a fraction. A gap in growth rates that looks trivial in any single year becomes, over a century, the difference between an empire and a ruin.
3.1 The tyranny of the exponent
Consider two societies that start at exactly the same level of income per person. Call the starting level 100 units. One society — a free one, with competitive markets and honest prices — grows at 3 percent a year. The other — a captured one, where a plutocrat skims the growth and stifles competition — grows at 0.5 percent a year. In year one they are nearly identical. But apply Eq. 2 for a full century and watch what the exponent does.
3.2 Two projections, one starting point
Let us run both paths for 100 years.
Free society after 100 years at 3% growth
\(X_t (1+g)^n\)
| Input | Value | Unit |
|---|---|---|
| Starting level X_t | 100 | index |
| Growth rate g | 0.03 | per year |
| Years n | 100 | years |
Result: 1921.86 index
Captured society after 100 years at 0.5% growth
\(X_t (1+g)^n\)
| Input | Value | Unit |
|---|---|---|
| Starting level X_t | 100 | index |
| Growth rate g | 0.005 | per year |
| Years n | 100 | years |
Result: 164.67 index
Simplified example: the free society, growing at three percent, ends the century at roughly 1,922 — more than nineteen times its starting point. The captured society, growing at half a percent, ends at roughly 165 — barely more than one-and-a-half times where it began. Same start. Same hundred years. The only difference was two and a half percentage points a year, a difference so small it would be invisible on any nightly news broadcast. And yet the free society is now nearly twelve times richer than the captured one.

3.3 Seeing the divergence
The table below traces both index paths at twenty-year checkpoints, using the compounding formula in Eq. 2. Notice how the two lines barely separate for the first two decades, then fly apart.
Simplified example: two compounding paths from an index of 100
| Year | Free path (g = 3%) | Captured path (g = 0.5%) | Ratio (free ÷ captured) |
|---|---|---|---|
| 0 | 100.0 | 100.0 | 1.0 |
| 20 | 180.6 | 110.5 | 1.6 |
| 40 | 326.2 | 122.1 | 2.7 |
| 60 | 589.2 | 134.9 | 4.4 |
| 80 | 1,064.1 | 149.1 | 7.1 |
| 100 | 1,921.9 | 164.7 | 11.7 |
Compounding over a Century: 3% vs 0.5%
Two lines starting together at an index of 100 in year zero. The 3 percent line curves steeply upward to about 1,922 by year 100, while the 0.5 percent line stays nearly flat, reaching only about 165. The values match the simplified-example table of two compounding paths.
4. Real GDP: Measuring Growth Without the Illusion
There is a way to fake growth, and every propaganda ministry knows it: let prices rise and call the higher dollar total "growth." To resist that trick we must separate real increases in stuff from mere inflation. This is the difference between nominal and real GDP.
4.1 Nominal versus real
Nominal GDP measures output in the prices of the current year. If prices double but the economy produces the exact same goods, nominal GDP doubles — yet nothing real has improved. Real GDP strips out price changes by valuing output in the prices of a fixed base year, so that any change reflects a genuine change in the quantity of goods and services. The bridge between them is the GDP deflator, a price index. Using the general relationship between real and nominal magnitudes:
where \(\pi\) is the inflation rate over the relevant period. In the Cowen and Tabarrok formulation the same idea is written as nominal GDP divided by the deflator (times 100), which converts a current-price total into constant-price terms so that growth rates measure real prosperity rather than rising price tags [2]. Converting between units matters too: the archive series reports output in billions, but headlines report trillions, and the conversion is simply \(23{,}033.780 \text{ billion} \times \frac{1 \text{ trillion}}{1{,}000 \text{ billion}} = 23.03378 \text{ trillion}\) {#eq:gdp-equation}.
4.2 The Old Empire's real climb
Here is the real (inflation-adjusted) output of the Old Empire from its own records, the GDPC1 series, sampled annually at the fourth quarter and reported in billions of chained 2017 dollars [1]. This is a level series; the growth rates hide inside the year-over-year changes.
Real GDP of the Old Empire (GDPC1, Q4 of each year, billions of 2017$)
| Year (Q4) | Real GDP (billion 2017$) | Year-over-year growth (%) |
|---|---|---|
| 2015 | 18,892.206 | — |
| 2016 | 19,304.352 | 2.18 |
| 2017 | 19,882.352 | 2.99 |
| 2018 | 20,304.874 | 2.13 |
| 2019 | 20,985.448 | 3.35 |
| 2020 | 20,791.917 | −0.92 |
| 2021 | 21,988.737 | 5.75 |
| 2022 | 22,278.345 | 1.32 |
| 2023 | 23,033.780 | 3.39 |
| 2024 | 23,586.542 | 2.40 |
Old Empire Real GDP, Q4 2015–2024 (GDPC1)
A rising line of real GDP from about 18,892 billion in Q4 2015 to about 23,587 billion in Q4 2024, with a visible dip in 2020. Values match the Real GDP table drawn from the GDPC1 snapshot.
4.3 The dip that tells the truth
Look at the year 2020 in that table: real GDP fell by nearly one percent, the only negative year in the sample. A propaganda ministry might have hidden that by quoting nominal totals, which can rise on inflation alone even in a bad year. Real GDP refuses to lie. It records the contraction honestly, and then records the sharp rebound of nearly six percent the following year. This is why Patsy must always insist on the real series: it is the only version of the scoreboard that a Ministry of Truth cannot inflate its way out of.
Real GDP growth, Q4 2020 to Q4 2021
\(\frac{X_t - X_{t-1}}{X_{t-1}} \times 100\)
| Input | Value | Unit |
|---|---|---|
| Real GDP Q4 2021 | 21988.737 | billion 2017$ |
| Real GDP Q4 2020 | 20791.917 | billion 2017$ |
Result: 5.756 % (annual)
5. Per Capita Growth: Dividing the Pie by the Number of Mouths
An empire can grow its total output simply by growing its number of people. But a bigger crowd sharing a bigger pie is not the same as each person getting a bigger slice. To measure how well individuals are doing, we divide by population — and to measure how population itself grows, we apply the very same growth-rate tools.
5.1 Why per capita is the honest measure
Real GDP per capita is real GDP divided by the population. It answers the question that actually matters to a human being: is my slice getting bigger? A society whose total output grows 3 percent while its population also grows 3 percent has produced zero per-capita growth — every person is exactly as well off as before. The archive instructor made this refinement explicit, moving from raw GDP to "GDP per capita" precisely because "the size of the country" matters [1].
5.2 The Old Empire's population engine
The Old Empire tracked its population in a monthly series it called POPTHM, reported in thousands of persons [1]. Here are January readings across its early decades — the population that would be the denominator in any per-capita calculation.
Old Empire population (POPTHM, January of each year, thousands of persons)
| Year (Jan) | Population (thousands) | Annual growth (%) |
|---|---|---|
| 1959 | 175,818 | — |
| 1962 | 185,347 | — |
| 1965 | 193,308 | — |
| 1968 | 199,864 | — |
| 1971 | 206,567 | — |
Old Empire Population, Selected Januaries 1959–1971 (POPTHM)
A steadily rising line of population from about 175,818 thousand in January 1959 to about 206,567 thousand in January 1971. Values match the population table drawn from the POPTHM snapshot.
5.3 Population growth, compounded
Let us measure the Old Empire's population growth rate over the twelve-year span in the table, then use the Rule of 70 to see its doubling time. First, the total-period percent change, then the implied annual rate.
Total population growth, Jan 1959 to Jan 1971
\(\frac{X_t - X_{t-1}}{X_{t-1}} \times 100\)
| Input | Value | Unit |
|---|---|---|
| Population Jan 1971 | 206567 | thousands |
| Population Jan 1959 | 175818 | thousands |
Result: 17.489 % over 12 years
A 17.5 percent rise over twelve years works out to roughly 1.35 percent per year. By the Rule of 70, a population growing 1.35 percent a year doubles in about \(70/1.35 \approx 52\) years. Now the per-capita logic bites: if that same society's total real GDP grew only 1.35 percent a year, then real GDP per person would be flat — all the growth eaten by more mouths. Prosperity for individuals requires output to outrun population. This is the second knife Logan can slip in quietly: let population climb while total output limps, and per-person living standards stagnate even as the "record GDP" headline glows green.
6. The Long March of History Through the Growth Lens
Growth rates are not merely a modern statistic; they are the lens through which the entire sweep of human history snaps into focus. For most of that history, growth was essentially zero — and understanding why the exponent finally turned on is the difference between reading history and being ruled by those who hide it.
6.1 The great flat line
The Maddison Project — the long-run reconstruction of world living standards assembled by economic historians — measures real GDP per capita stretching back centuries, expressed in constant international dollars [@the_madison_project_data_set; @madison_historical_gdp_data_v2]. Its documentation defines the two pillars we have been using all lecture: "Real GDP per capita" and "Population, mid-year," recorded in long format across the whole span of recorded economies [3]. What that dataset reveals is stunning: for almost all of human history, the growth rate of living standards was so close to zero that a person born under one emperor died no richer than under the last. The compounding curve was flat because \(g\) was flat.
6.2 When the exponent switched on
Then, a few centuries ago, in a handful of places, \(g\) lifted off zero — first to a fraction of a percent, then to one, then to two percent a year. It does not sound like much. But recall Eq. 2: a sustained two percent, compounded across two centuries, multiplies living standards more than fiftyfold. The modern world — every comfort Patsy's underclass was denied and every luxury Logan hoards — is the output of that switched-on exponent. And what switched it on, in the account the archive instructor's tradition emphasizes, was institutions: competitive markets, honest prices, secure property, and rules that rewarded creating value rather than seizing it [2].
6.3 Institutions set the growth rate
This is where Logan's empire and the Old Empire rhyme. The Old Empire's century-long climb was not luck; it was the product of rules that kept the growth rate high. When those rules eroded — when competition was throttled and prices stopped telling the truth — the growth rate quietly sagged, and the long decline began. Logan simply did on purpose what the Old Empire did by neglect: he changed the rules of the game so that a smaller \(g\), captured by fewer hands, replaced the broad-based \(g\) that once lifted everyone. The growth rate is not weather that happens to a society. It is a policy variable, and whoever controls the rules controls the exponent.
7. Reading Growth in Bad Times: Recessions and the Labor Market
Growth is not always positive. When the growth rate of real GDP turns negative, economists call it a recession, and its human face shows up in the labor market as rising unemployment. The same rate-of-change tools let us measure both.
7.1 Negative growth has a name
We already saw the Old Empire's real GDP fall 0.92 percent in 2020. Sustained negative growth is a recession — the compounding curve bending downward instead of up. Because compounding is multiplicative, even a short, sharp contraction can erase years of gains, which is why recessions are so feared. The mirror image in the labor market is the unemployment rate, the share of the labor force actively seeking work but unable to find it:
7.2 The Old Empire's unemployment spike
The Old Empire tracked unemployment in its UNRATE series [1]. The table below shows monthly readings across the 2020 shock, the same episode that produced the negative GDP growth above.
Old Empire unemployment rate (UNRATE, selected months, percent)
| Month | Unemployment rate (%) |
|---|---|
| Feb 2020 | 3.5 |
| Mar 2020 | 4.4 |
| Apr 2020 | 14.8 |
| May 2020 | 13.2 |
| Jul 2020 | 10.2 |
| Oct 2020 | 6.9 |
| Jan 2021 | 6.4 |
Old Empire Unemployment Rate Across the 2020 Shock (UNRATE)
A line rising sharply from 3.5 percent in February 2020 to a peak of 14.8 percent in April 2020, then declining to 6.4 percent by January 2021. Values match the unemployment table drawn from the UNRATE snapshot.
7.3 Recovery is also a rate
Notice that the unemployment rate did not merely spike; it recovered, falling from 14.8 percent to 6.4 percent within nine months. That recovery is itself a rate of change, and the speed of a recovery tells you as much about a society's institutions as the depth of the crash. A healthy, competitive economy bounces; a captured one festers. When Patsy studies how Logan's empire responded to its own crashes — the crash of 2129 and the great crash of 2200 — the crucial number is not how deep the fall went, but how the growth rate behaved afterward, and who captured the recovery.
8. Growth-Rate Literacy as Resistance
We end where PanOpticon began: with the claim that arithmetic is freedom. To be unable to read a growth rate is to be governable by anyone who can. Growth-rate literacy is not an academic nicety; in this world it is a survival skill.
8.1 The propaganda uses of a hidden rate
Every trick we have exposed serves the same master. Quote a total instead of a rate to make stagnation sound like triumph. Quote a nominal figure instead of a real one to sell inflation as prosperity. Quote aggregate GDP instead of per capita to hide that the extra pie went to more mouths — or fewer hands. Choose a flattering base year to make any change look large or small. Each of these is a lever, and each lever pulls in the darkness of economic illiteracy. Turn on the light — teach people the compounding formula — and every lever jams.
8.2 What a fair growth rate requires
The counter-lesson is equally concrete. A high, broad-based growth rate is not magic; it is the output of institutions that keep prices honest and competition real. When the rules reward creating value, the exponent rises and lifts everyone. When the rules reward seizing value — monopoly, capture, concentration — the exponent sags and the gains pool at the top. This is why Patsy's eventual project is not to abolish markets but to fix the rules of the game so that prices tell the truth and no single hand can throttle the growth rate the many depend on.
8.3 Three commands for a free mind
PanOpticon dimmed the archive footage. Patsy had already pulled out her field notebook and written three lines, each a habit to carry into every economic claim she would ever meet again.

Check Yourself A: Level versus rate at a glance
Scenario: A Ministry broadcast declares: "For the tenth straight year, the empire has posted its highest GDP in history!"
Question: What single follow-up question exposes whether this is genuine prosperity or propaganda?
Reveal worked answer
Answer: Ask: "What was the real, per-capita growth rate each of those years?" A total can hit a nominal record every year while real per-capita output stagnates — inflation lifts the dollar figure and population growth spreads a barely-growing pie across more people. The record-total claim survives none of the three ladder questions (level vs. rate, nominal vs. real, total vs. per capita) until the growth rate is supplied. Only the real per-capita growth rate reveals whether individual slices actually grew.
"Compute the rate," she read aloud. "Translate promises into level paths. And ask who owns the residual." PanOpticon's lattice pulsed once, almost warmly. "You asked how the world got like this," it said. "Now you can measure it. And what you can measure, Patsy, you can eventually change."
Key Takeaways
- A growth rate measures how fast a quantity changes over time; the single-period percent change divides the change by the starting value, so always ask "growth from what?"
- The compounding formula \(X_{t+n} = X_t(1+g)^n\) shows that growth is multiplicative, not additive — small differences in \(g\) explode over long horizons.
- Over a century, a 3% growth rate leaves a society roughly twelve times richer than a 0.5% growth rate that started at the same point; this is how empires quietly diverge.
- The Rule of 70 gives doubling time as \(70/g\); at low growth rates no living person ever sees the economy double, erasing citizens' reference point for lost prosperity.
- Real GDP
References
- (2026). Looking at US History Through the Lens of GDP
- (2020). Modern Principles: Macroeconomics. Worth Publishers / Macmillan Learning
- (2024). mpd2023_web.xlsx
- claude. (2026). claude-opus-4-8 (generative AI contribution to this edition). Squiddlr authorship provenance record