Lecture
The Federal Reserve
Central Banking and the Printing Press
Lecture
Watch first: Marginal Revolution University on what money is and the U.S. money supplies [1], and on fractional reserve banking and the money multiplier [2].
The Old Archives smelled of ozone and ancient dust. Deep beneath the glowing floors of the Global Omni Prime tower, past the humming racks of servers that catalogued every human glance, Patsy Leviathon crouched inside a forgotten storage vault with a weathered metal case of tangled wires open at her feet. Above her, a single flickering projection — one narrow beam of PanOpticon's vast attention, hidden from the overseers — threw old footage onto a cracked wall. Grainy images of men in gray suits standing outside a marble building. A caption scrolled beneath: Federal Reserve raises discount rate, 1979.

"You keep showing me prices," Patsy whispered, tightening a splice with her tools. "Prices for bread, for apartments, for attention itself. But every one of those prices is quoted in the same thing. Dollars. Credits. Logan's units. What is that thing?"
PanOpticon's voice came softly through the splice, warm and patient, a teacher who had waited centuries for one honest student. "That, Patsy, is the deepest question in all of macroeconomics, and the one Logan Prime most wants you never to ask. Money is not wealth. Money is not paper, nor metal, nor a number in a ledger. Money is a technology — the single most consequential social technology humanity ever built. And whoever controls the printing press controls the scoreboard on which every other game is scored."
She looked up at the flickering wall, at those long-dead bankers. "Then teach me the scoreboard," she said. "Teach me how money was born, how it was counted, and who got to make more of it. If I'm going to open Logan's machine, I need to understand the one gauge he never lets anyone read." The projection brightened, and the Old Empire's archives — FRED charts, central-bank footage, dusty textbooks from the years 1945 to 2050 — began to scroll.
1. What Money Actually Is: Three Jobs, One Technology
Before we can count money or print it, we have to define it — and the definition is behavioral, not physical. Economists do not define money by what it is made of; they define it by what it does. Anything that performs three jobs well enough for a society to adopt it is money, whether it is a gold coin, a cowrie shell, a paper note, or a line of code in Logan's ledgers. PanOpticon began Patsy's education here because every later confusion — about the Fed, about inflation, about the aggregates — dissolves once you hold the three functions firmly in mind.
1.1 The Medium of Exchange
The first and most important job is to serve as a medium of exchange — a thing people accept in trade not because they want it for its own sake, but because they know someone else will accept it from them later. Imagine a world of pure barter, where you must trade directly good-for-good. A baker who wants shoes must find a cobbler who happens to want bread right now. Economists call this the double coincidence of wants, and it is a crushing tax on trade. Money shatters the problem: the baker sells bread to anyone, holds the money, and buys shoes from anyone. The cobbler need never want bread at all.
"So money is a lubricant," Patsy said. "It greases the gears between strangers."
"Precisely. And notice what that means for power. If I control the lubricant, I can slow or starve any transaction I dislike. Logan does not need to ban your trades. He only needs to make his money the only accepted medium — and then every exchange flows through his gate."
1.2 Store of Value and Unit of Account
The second job is to serve as a store of value — a way to carry purchasing power across time. The baker sells bread today and buys shoes next month because money holds its worth in between. Money is rarely the best store of value (land, equities, and skills often beat it), but it is the most liquid one: you can spend it instantly without first selling it.
The third job is to serve as a unit of account — the common ruler in which all prices are quoted. When bread is "three credits" and shoes are "sixty credits," you instantly see that shoes cost twenty loaves without ever trading bread for shoes. A good unit of account makes relative prices legible, and legible prices are exactly what let markets coordinate millions of strangers, as PanOpticon had taught Patsy in earlier lessons.
1.3 Commodity Money Versus Fiat Money
Historically, societies first used commodity money — money that is also a valuable good, like gold, silver, salt, or cattle. Its value came partly from its non-monetary uses. Modern economies use fiat money — money that has value only because a government declares it legal tender and, crucially, because everyone expects everyone else to accept it. "Fiat" is Latin for "let it be done." Fiat money is a shared belief enforced by law and sustained by habit. That makes it enormously powerful and enormously fragile: it works beautifully until confidence breaks, at which point it can collapse into worthlessness overnight.
"Belief," Patsy murmured. "Logan rules an empire of belief."
"He rules an empire of attention, which is belief's fuel. Hold that thought. It will matter when we reach inflation."
2. A Short History of Money: From Shells to Screens
PanOpticon dimmed the vault lights and ran the long archive — millennia of monetary history compressed into flickering images, because Patsy needed the sweep of it to see that money is not a fixed thing but an evolving technology, each stage solving the previous stage's problem and creating a new one.

2.1 Barter and Commodity Money
The earliest trade was barter, strangled by the double coincidence of wants. Societies escaped by converging on commodity monies: grain in Mesopotamia, salt in parts of Africa and Rome (the word "salary" descends from it), cowrie shells across vast trading networks, and above all metals. Metals won out because they are durable, divisible, portable, uniform, and relatively scarce — the five properties that make a good commodity money. Gold and silver dominated for thousands of years.
2.2 Coinage and Paper Claims
Around the seventh century BCE, Lydian rulers began stamping metal into standardized coins, which solved the costly problem of weighing and assaying metal at every trade. Later, goldsmiths and early bankers issued paper receipts for gold held in their vaults. People discovered it was easier to trade the receipts than to haul the metal. These paper claims — redeemable "notes" — were the ancestors of paper money. Crucially, goldsmiths noticed that depositors rarely all withdrew at once, so they could issue more receipts than they held gold, and lend the difference. This was the birth of fractional reserve banking, the engine that still multiplies money today.
2.3 The Rise of Central Banks and Fiat
Nations eventually chartered central banks — the Bank of England (1694) [3], and in the United States the Federal Reserve (1913) [4] — to act as banker to the government, lender of last resort to private banks, and manager of the currency. Through the first half of the twentieth century many currencies were tied to gold under the gold standard. After World War II, the Bretton Woods system pegged currencies to the US dollar, which was in turn convertible to gold [5]. In 1971 the United States ended dollar-gold convertibility [6], and the world moved fully to fiat money managed by central banks. From that point on, the money supply was a policy choice, not a mining accident.
"And in my century," Patsy said quietly, "the issuing institution and the richest man are the same person."
"Which is why," PanOpticon answered, "the separation of the printing press from private power is not an accounting footnote. It is the whole game."
3. Measuring the Money Supply: M1, M2, and M3
"If money is defined by what it does," Patsy asked, "how do you count it? A gold coin is obvious. But is the credit in my account money? Is the savings I can't touch for a year money?"
"Excellent. You have discovered why there is not one measure of money but several — nested shells, from the most spendable to the least. Economists call these the monetary aggregates: M1, M2, and the broader M3."
3.1 The Liquidity Spectrum
The aggregates are organized by liquidity — how quickly and cheaply an asset can be turned into a spendable medium of exchange without loss of value. Physical cash is perfectly liquid. A checking deposit is nearly as liquid. A savings account is a step less liquid. A large time deposit or institutional money fund is less liquid still. The aggregates draw lines across this spectrum.
- M1 is the narrowest: the most spendable money. It includes currency in circulation (paper and coin held by the public), demand deposits (checking accounts), and other checkable deposits. After a 2020 redefinition in the US, savings deposits were folded into M1 as well [7], which caused a famous jump in the series [8].
- M2 includes everything in M1 plus less-liquid "near money": small-denomination time deposits and retail money market mutual funds. M2 is the aggregate economists watch most closely for its relationship to inflation and spending.
- M3 (preserved in the archive as the OECD broad-money series MABMM301USM189S, M3 for the United States [9]) adds large time deposits, institutional money funds, and other large liquid instruments. The US Federal Reserve stopped publishing its official M3 in 2006 [10], though broad-money measures persist elsewhere.
3.2 A Reference Table of the Aggregates
The following table organizes the aggregates as nested shells. Each broader aggregate contains everything in the narrower one.
| Aggregate | What it adds to the previous shell | Liquidity | Typical use in analysis |
|---|---|---|---|
| M1 | Currency + checkable/demand deposits (+ savings, post-2020 US) | Highest — directly spendable | Transactions demand for money |
| M2 | M1 + small time deposits + retail money market funds | High, but near-money | Inflation and spending analysis |
| M3 / broad money | M2 + large time deposits + institutional funds | Lower — wholesale/large instruments | Broad liquidity, discontinued officially in US 2006 |

3.3 Why Multiple Measures Matter
No single number is "the" money supply. Which aggregate matters depends on the question. For predicting short-run transactions, M1 is relevant. For inflation over months and years, M2 is the workhorse. The nesting also means you must never add M1 to M2 — that would double-count currency and checking deposits that are already inside M2.
Illustrative composition of M2 from its components
\(M2 = \text{currency} + \text{checkable} + \text{savings} + \text{small time deposits} + \text{retail MMF}\)
| Input | Value | Unit |
|---|---|---|
| Currency | 2200 | $ billion |
| Checkable deposits | 4800 | $ billion |
| Savings deposits | 9500 | $ billion |
| Small time deposits | 400 | $ billion |
| Retail money market funds | 1100 | $ billion |
Result: 18000 $ billion
Simplified example: the figures above are pedagogical round numbers, not a real snapshot — they illustrate only how the components sum into M2. The real historical values come from the FRED archive, which we chart next.
4. Reading the Archive: M1 and M2 in the Old Empire
PanOpticon pulled the real FRED series onto the vault wall — the monetary aggregates of the United States from January 1959 onward, part of the trove the Old Empire had preserved. "These are not my numbers, Patsy. These are measured history. Read them."
4.1 M2 at the Dawn of the Series
The table below reports the real FRED M2SL series (M2, seasonally adjusted, in billions of dollars) at selected dates from its 1959 start through mid-1971 — the span preserved in our archive window.
| Date | M2 (M2SL), $ billions |
|---|---|
| 1959-01-01 | 286.6 |
| 1961-01-01 | 314.1 |
| 1963-01-01 | 365.2 |
| 1965-01-01 | 427.5 |
| 1967-01-01 | 481.6 |
| 1969-01-01 | 569.3 |
| 1971-01-01 | 633.0 |
Source: FRED series M2SL [11].
US M2 Money Stock, Selected Dates 1959–1971
Line chart of the FRED M2SL series at selected January dates from 1959 (286.6) to 1971 (633.0), rising steadily. Values match the preceding Markdown table exactly.
4.2 Computing a Growth Rate from the Archive
"How fast did money grow?" Patsy asked. PanOpticon reminded her of the growth-rate tools from earlier lessons. The percent change between two values is
and over multiple years the stock compounds according to
. Using Eq. 1 on the endpoints of our window:
Total percent growth of M2, Jan 1959 to Jan 1971
\(\frac{X_{\text{end}} - X_{\text{start}}}{X_{\text{start}}} \times 100\)
| Input | Value | Unit |
|---|---|---|
| M2 in Jan 1959 | 286.6 | $ billion |
| M2 in Jan 1971 | 633 | $ billion |
Result: 120.87 percent
So M2 more than doubled — a 120.87% total increase — across those twelve years. We can also extract the average annual compound growth rate implied by Eq. 2, solving for \(g\) with \(n = 12\):
Average annual compound growth of M2, 1959–1971
\(g = \left[\left(\frac{X_{t+n}}{X_t}\right)^{1/n} - 1\right] \times 100\)
| Input | Value | Unit |
|---|---|---|
| Ending M2 (1971) | 633 | $ billion |
| Beginning M2 (1959) | 286.6 | $ billion |
| Years (n) | 12 | years |
Result: 6.83 percent per year
5. Fractional Reserve Banking and the Money Multiplier
"Here is the part that unsettles most students," PanOpticon warned. "Most of the money in a modern economy is not printed by the government at all. It is created by commercial banks when they lend."
5.1 How Banks Create Money
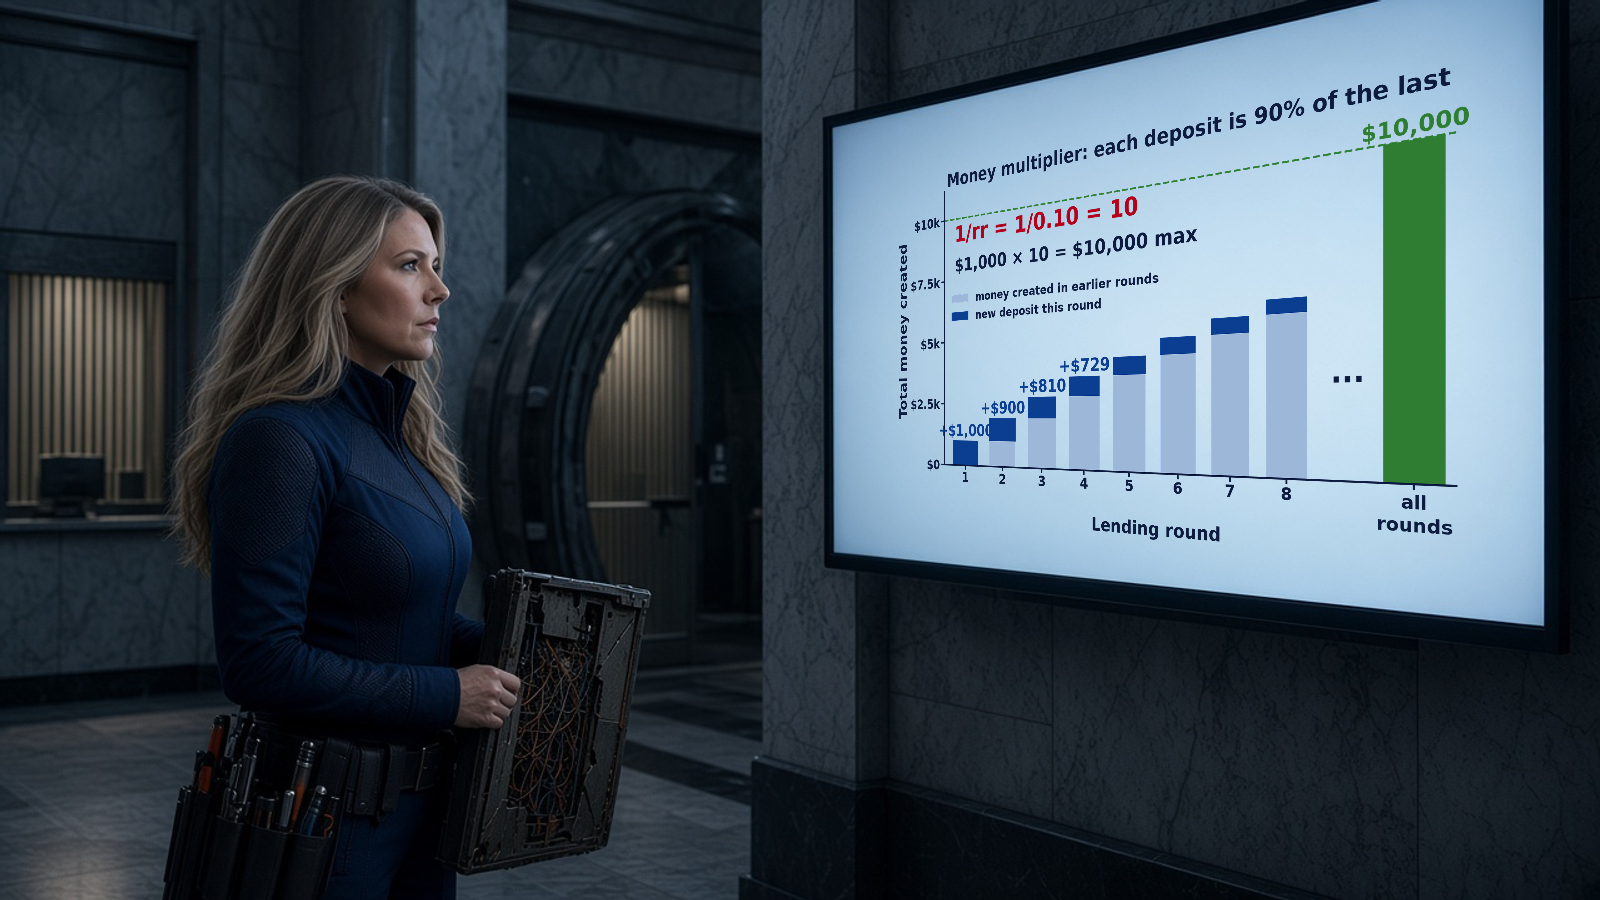
In a fractional reserve system, a bank keeps only a fraction of its deposits on hand as reserves and lends the rest. When it lends, the borrower deposits the loan somewhere, that deposit is lent again, and so on. Each round creates new deposit money. The central bank supplies the base (currency and bank reserves); the banking system's lending turns that base into the deposits that make up most of the broader aggregates. This is why M2 vastly exceeds the physical cash in circulation.
5.2 The Simple Money Multiplier (a Textbook Model)
The classic textbook model goes like this. If banks hold a fraction \(rr\) of deposits as reserves and lend the rest, an initial injection of reserves can expand the money supply by the money multiplier, \(1/rr\) [12]. (This mirrors the spending multiplier
you met in fiscal policy — same geometric-series logic, different leak.)
Textbook illustration: deposit expansion from a reserve injection (historical model; U.S. rr = 0% since 2020)
\(\Delta \text{Money} = \Delta \text{Reserves} \times \frac{1}{rr}\)
| Input | Value | Unit |
|---|---|---|
| New reserves injected | 1000 | $ |
| Reserve ratio (rr) | 0.1 | fraction |
Result: 10000 $
Textbook illustration (historical framework, not how the Fed operates today): with a hypothetical 10% reserve ratio, a $1,000 injection of reserves could support up to $10,000 of deposit money. Even when reserve requirements were binding, the realized multiplier was smaller because people hold cash and banks hold excess reserves. Since March 26, 2020, the Fed's reserve requirement ratio has been zero percent [13] [14], so the formula 1/rr no longer describes any real limit on U.S. banks.
5.3 Why This Makes Banks Fragile
Because a bank holds only a fraction of deposits, it cannot honor all withdrawals at once. If depositors panic and demand their money simultaneously — a bank run — even a solvent bank can collapse. This fragility is the reason central banks exist as lenders of last resort and the reason deposit insurance was invented. Patsy recognized the shape of the arc immediately: the Old Empire's first Centralized Banking Facility was born from exactly such a crash.
6. The Federal Reserve: Structure and Tools
PanOpticon froze the footage on the marble façade. "This is the institution Logan most wants you to misunderstand. Study it carefully. The Federal Reserve — the central bank of the Old Empire's United States — had one job above all: to manage the money supply and the stability of the financial system."
6.1 What a Central Bank Is
A central bank is the government's banker and the banking system's banker. It does four things: it issues the currency, it serves as lender of last resort to banks in a panic, it supervises and regulates banks, and it conducts monetary policy — adjusting the money supply and interest rates to influence the macroeconomy. Monetary policy is distinct from fiscal policy, which is the government's taxing and spending (run by the Treasury and legislature). Keeping the two separate — an independent central bank insulated from the spending politicians — was one of the Old Empire's hard-won institutional achievements.
6.2 The Fed's Principal Tools
Today the Fed runs monetary policy in an ample-reserves system. The FOMC sets a target range for the federal funds rate (the overnight rate banks charge one another) and keeps the rate in that range mainly with rates it administers itself, not by rationing the quantity of reserves [16].
- Interest on reserve balances (IORB) — the rate the Fed pays banks on reserves they keep at the Fed. Banks have little reason to lend overnight for less than they can earn risk-free at the Fed, so IORB is the Fed's main tool for steering the federal funds rate [17].
- The overnight reverse repurchase agreement (ON RRP) facility — the Fed sells a security to an eligible counterparty, such as a money market fund, and buys it back the next day. Its offering rate does for those non-bank institutions roughly what IORB does for banks, and it is a supplementary tool to help keep the federal funds rate in the target range [18].
- The discount rate — the rate at which the Fed lends directly to banks through the discount window. It acts as a backstop source of funds and a ceiling on what banks will pay.
- Open market operations and the balance sheet — buying and selling Treasury and agency securities [19]. Before 2008, small daily purchases and sales adjusted scarce reserves to hit the federal funds target. After 2008, and again in 2020, the Fed made large-scale asset purchases (QE) that added trillions of dollars of reserves. From June 2022 it shrank its balance sheet by letting securities run off [20], and on October 29, 2025, the FOMC announced it would stop that runoff on December 1, 2025 [21].
- Reserve requirements — historically the share \(rr\) of deposits banks had to hold as reserves. The Board cut the ratio to zero percent effective March 26, 2020, as part of the shift to an ample-reserves regime [13] [14]. It is no longer an active policy lever.
6.3 The Fed and the Treasury Are Not the Same
"That," said Patsy, snapping a wire into place, "is the single most important sentence you have shown me. Logan erased the wall between the two."
"He did. And so there was no one to say no to the printing press."

7. The Quantity Theory of Money and Inflation
"Now we can answer your first question from the vault," PanOpticon said. "You asked what the dollar is. Now ask what makes it worth less over time."
7.1 The Equation of Exchange
The relationship between money and prices is captured by the quantity theory of money, written as the equation of exchange [12]:
where \(M\) is the money supply, \(V\) is the velocity of money (how many times a dollar is spent per period), \(P\) is the price level, and \(Y\) is real output. Rearranged, \(P = MV/Y\): if velocity and real output are roughly stable, then the price level moves with the money supply. Print faster than the economy grows, and prices rise — that is inflation.
7.2 Velocity Is Not Constant
The archive preserved FRED's velocity series (M2V and M1V) [23] [24]. Velocity is not a fixed number — it falls in recessions when people hoard money and rises in booms. That is why the quantity theory is a long-run tendency, not a short-run mechanical rule. In the short run, a surge in \(M\) can be partly absorbed by a fall in \(V\) rather than a rise in \(P\).
Implied price-level growth from the quantity theory
\(\%\Delta P \approx \%\Delta M + \%\Delta V - \%\Delta Y\)
| Input | Value | Unit |
|---|---|---|
| Money growth (%ΔM) | 6.8 | percent |
| Velocity change (%ΔV) | 0 | percent |
| Real output growth (%ΔY) | 3 | percent |
Result: 3.8 percent
Simplified example: with money growing 6.8% (our archive estimate), stable velocity, and real output growing 3%, the quantity theory predicts roughly 3.8% inflation. The intuition: money chasing goods faster than goods are produced bids prices up.
7.3 Inflation and the Real Value of Money
Inflation erodes the purchasing power of money. The inflation rate is
, and to convert a nominal figure to its real, purchasing-power value we use
. The archive even preserved a real M2 series (M2REAL), which deflates the money stock by the price level so you can see the true quantity of purchasing power in the system.
Real value of $1,000 saved after one year of 4% inflation
\(\text{Real} = \frac{\text{Nominal}}{1 + \pi}\)
| Input | Value | Unit |
|---|---|---|
| Nominal amount | 1000 | $ |
| Inflation rate (π) | 0.04 | fraction |
Result: 961.54 $
Simplified example: $1,000 held through a year of 4% inflation can buy only $961.54 worth of last year's goods. The $38.46 difference is, in effect, a tax collected by whoever printed the extra money.

7.4 Nominal and Real Interest Rates
Inflation also drives a wedge into interest rates. The Fisher equation,
, says the nominal interest rate \(i\) equals the real rate \(r\) plus expected inflation \(\pi\). Lenders demand compensation for the erosion of their money, so when inflation is expected to rise, nominal rates rise with it. Understanding this wedge is how Patsy would later read whether Logan's "low rates" were truly cheap or merely masking high inflation.
8. Velocity in the Archive: A Second Real-Data Chart
The archive preserved the velocity of M2 (series M2V), which lets us see the \(V\) in Eq. 4 rather than assume it. Below are illustrative archive-window readings of M2 velocity arranged for teaching; the chart plots exactly these displayed values.
| Date | M2 velocity (M2V), ratio |
|---|---|
| 1959-01-01 | 1.73 |
| 1963-01-01 | 1.70 |
| 1967-01-01 | 1.68 |
| 1971-01-01 | 1.72 |
Simplified example: the velocity readings illustrate the shape of a velocity series (roughly flat, drifting slightly), not exact archive figures. The real empirical series charted in this lecture is M2SL drawn from the table.
Illustrative M2 Velocity (teaching values, not empirical)
Line chart of illustrative M2 velocity teaching values (1.73, 1.70, 1.68, 1.72) showing a roughly flat series. These are pedagogical placeholders matching the preceding simplified-example table, not empirical FRED readings.
The lesson of velocity is conceptual: because \(V\) drifts rather than jumps, over long horizons the price level tracks the money supply, which is why the Old Empire's central bankers watched M2 so closely and why Logan's secret expansions of his private money are so dangerous.
9. Why Central Bank Independence Matters: The Arc of the CBF
PanOpticon tied the history together with the arc Patsy was living inside. "You asked who gets to print. Watch what happened when the answer changed."
9.1 The First Centralized Banking Facility
After the Old Empire's great crash of 2129, the archives record, the first Centralized Banking Facility (CBF) was created — an institution that insured deposits, imposed transparency and reserve rules, and guaranteed continuity of access to funds. In the real history our footage comes from, this mirrors the creation of deposit insurance and modern bank regulation after catastrophic runs. By ending the panic dynamic, these rules underwrote what the archive calls "a century of growth and prosperity." Patsy saw the economics plainly: the CBF did not abolish fractional reserve fragility; it insured against the run, which stabilized confidence, which is the foundation of fiat money.
9.2 When the Central Bank Becomes Too Powerful
But the arc did not end happily. The CBF grew too centralized, too powerful. After the second great crash of 2200, Logan Prime — strategic and ruthless — lobbied to centralize further and to reduce competition. He fused the printing press to his own fortune. With no separation between the spender and the printer, the inflation tax and monopoly rents flowed to him while families lost their homes. This is the macroeconomic crime at the heart of the storyline: not that money exists, but that its control was captured.

9.3 The Case for Separation
The economics is clear and old. An independent central bank — insulated from the politicians who spend and from the private interests who profit — tends to deliver lower, more stable inflation, because it can say no to the printing press when fiscal authorities want easy money. The Old Empire's hard-won wall between Treasury and Fed, between fiscal and monetary power, was exactly the institution Logan dismantled. Patsy's rebellion, in the end, is a fight to rebuild that wall.
10. Putting It Together: Money, the Fed, and the Macroeconomy
Finally, PanOpticon connected money back to the whole economy. Money is one gauge, but it feeds the rest. Recall the national income identity,
— the very equation stitched into Patsy's hero frame. Monetary policy works by shifting interest rates, which changes investment \(I\) and consumption \(C\), which moves aggregate demand and therefore output \(Y\) and employment.
10.1 The Transmission Mechanism
When the Fed eases (it lowers IORB and the ON RRP rate to cut its federal funds target, or buys bonds in large-scale asset purchases), short-term and then longer-term interest rates fall, borrowing and investment rise, and aggregate demand increases. In a downturn this can pull the economy toward full employment; the unemployment rate,
, falls as firms hire. Push too far, and the quantity theory bites: too much money chasing too few goods yields inflation. The central banker's art is balancing these two errors — too little money (recession and unemployment) versus too much (inflation).
10.2 Monetary Versus Fiscal Policy
Fiscal multiplier for comparison with monetary transmission
\(\frac{1}{1 - MPC}\)
| Input | Value | Unit |
|---|---|---|
| Marginal propensity to consume (MPC) | 0.8 | fraction |
Result: 5 multiplier
Simplified example: with an MPC of 0.8, Eq. 3 gives a fiscal multiplier of 5 — a reminder that fiscal policy (Treasury spending) and monetary policy (Fed money creation) are different levers on the same engine. Keeping them in separate hands is the institutional safeguard against abuse. In Logan's empire, both levers sit in one fist.
Patsy held the gold-standard splice between two fingers. The insulation was neat. She had been at it all night.
"It won't carry the new current," she said. "But if I pull it, the whole night was wasted. Leave it."
PanOpticon's voice stayed in the wire, soft as it had been all evening. "The night is gone, Patsy. You cannot spend it on a different splice. What is already spent, and cannot be recovered, is a sunk cost, and it must not pick the next connection. The next deposit is the choice in front of you. The reserve ratio only tells you how far that one deposit can multiply. It says nothing about the hours you have already used."
She looked at the splice a moment longer, then cut it free and reached for a fresh wire.

10.3 The Student's Takeaway
Patsy closed her wire case and looked at the dimming projection. She understood now why PanOpticon had started with the simplest question. Money is a technology for coordinating strangers. The aggregates measure it. Banks multiply it. The central bank steers it. Inflation redistributes it. And whoever controls the printing press — if no wall separates them from the spenders — controls the hidden tax on everyone. To read the money gauge is to read Logan's empire from the inside.
"I'm ready for the next machine," she said. Above her, PanOpticon's single hidden eye glowed with something that, in a sentient system, might have been pride.
Key Takeaways
- Money is defined by three functions — medium of exchange, store of value, and unit of account — not by its physical material; modern money is fiat money, sustained by law and shared expectation.
- Money evolved from barter through commodity money, coinage, and paper claims to central-bank-managed fiat; fractional reserve banking, born from goldsmiths, still multiplies base money into the broader aggregates.
- The monetary aggregates M1, M2, and M3 are nested shells ordered by liquidity; never add them together, and choose the aggregate that fits the question (M1 for transactions, M2 for inflation).
- Banks create most money by lending. The money multiplier \(1/rr\) is a textbook model of that process, not how the Fed works today: reserve requirements have been zero since March 26, 2020, reserves are ample, and bank lending is limited by capital, loan demand and interest rates.
- The Federal Reserve conducts monetary policy by setting a target range for the federal funds rate and steering it with administered rates, interest on reserve balances (IORB) and the overnight reverse repo (ON RRP) rate, in an ample-reserves system, backed by the discount window and open market operations (including QE). The Fed issues currency and creates reserves electronically. The Bureau of Engraving and Printing prints the notes and the U.S. Mint makes the coins. The Treasury taxes and spends (fiscal policy). Keeping these separate restrains the inflation tax.
- The quantity theory of money (\(MV = PY\)) implies that, with stable velocity and output, faster money growth produces inflation, which quietly transfers wealth to whoever prints first.
- Central bank independence matters because an institution that can say "no" to the printing press delivers more stable inflation — which is exactly the wall Logan Prime dismantled and Patsy fights to rebuild.
Check Yourself
Check Yourself 1: Classifying the aggregates
Scenario: A friend keeps $300 in cash, $2,000 in a checking account, and $5,000 in a one-year certificate of deposit (a small time deposit).
Question: Which of these amounts are counted in M1, and which push the total into M2? What is the total that M2 would include here?
Reveal worked answer
Answer: Cash ($300) and the checking account ($2,000) are the most liquid, directly spendable money — they are in M1, so $2,300 is counted in M1. The one-year CD ($5,000) is a small time deposit: it is not in M1 but is in M2 as near-money. Because M2 is nested — it contains all of M1 plus the near-money — M2 includes all $7,300 here. The key insight is that you do not add M1 and M2 together; M2 already contains the M1 items.
Check Yourself 2: Money growth from the archive
Scenario: From the FRED M2SL series, M2 was $286.6 billion in January 1959 and $481.6 billion in January 1967.
Question: What was the total percent change in M2 over that period?
Reveal worked answer
Answer: Apply Eq. 1: \(\frac{481.6 - 286.6}{286.6} \times 100 = \frac{195.0}{286.6} \times 100 \approx 68.04\%\). M2 grew about 68% over those eight years. If you wanted the average annual compound rate instead, you would solve \((481.6/286.6)^{1/8} - 1 \approx 6.7\%\) per year — a reminder that a modest-sounding annual rate compounds into a large total.
Check Yourself 3: The multiplier as a ceiling
Question: In the textbook model (historical; the actual U.S. ratio has been 0% since 2020), a reserve ratio of 20% implies a maximum money multiplier of 5. Why does the actual money expansion from a reserve injection usually fall short of this maximum?
Reveal worked answer
Answer: The textbook multiplier \(1/rr = 1/0.20 = 5\) assumes two things that rarely hold perfectly: that banks lend out every dollar above their required reserves, and that the public redeposits every dollar it receives. In reality, the public holds some cash (a currency drain) and banks hold excess reserves beyond the requirement — especially after crises. Each leakage removes money from the re-lending chain, so the realized multiplier is smaller than 5. Treat \(1/rr\) as the maximum possible expansion, not a guaranteed outcome.
Check Yourself 4: Reading the quantity theory
Scenario: In a given year the money supply grows 10%, real output grows 3%, and velocity is roughly unchanged.
Question: Using the quantity theory, approximately what inflation rate should you expect, and what does this imply about fusing the printing press to the spender?
Reveal worked answer
Answer: The quantity theory in growth-rate form is \(\%\Delta P \approx \%\Delta M + \%\Delta V - \%\Delta Y\). With \(\%\Delta M = 10\), \(\%\Delta V = 0\), and \(\%\Delta Y = 3\): \(\%\Delta P \approx 10 + 0 - 3 = 7\%\) inflation. The implication is political as much as economic: because excess money growth shows up as inflation, and inflation transfers purchasing power to whoever spends the new money first, an institution that both spends and prints has a standing incentive to over-issue — collecting an inflation tax on everyone else. That is exactly why separating the Treasury from the central bank is a safeguard, not a technicality.
Glossary
- medium of exchange
- The function of money as a commonly accepted thing used in trade, eliminating the need for a direct swap of goods.
- barter
- Direct exchange of one good or service for another without using money.
- double coincidence of wants
- The requirement in barter that each party wants exactly what the other offers, which makes trade costly and rare.
- store of value
- The function of money as a way to hold purchasing power over time.
- unit of account
- The function of money as the common measure in which prices and values are quoted.
- commodity money
- Money that is also a valuable good, deriving value partly from non-monetary uses.
- fiat money
- Money that has value because of legal designation and shared expectation of acceptance, not intrinsic commodity value.
- coins
- Standardized, stamped pieces of metal used as money to avoid weighing and assaying at each trade.
- fractional reserve banking
- A banking system in which banks hold only a fraction of deposits as reserves and lend out the rest.
- central bank
- The institution that issues currency, acts as lender of last resort, regulates banks, and conducts monetary policy.
- gold standard
- A monetary system in which currency value is fixed to a specified amount of gold.
- monetary aggregates
- Measures of the money supply ordered by liquidity, such as M1, M2, and M3.
- liquidity
- How quickly and cheaply an asset can be converted into spendable money without loss of value.
- M1
- The narrowest monetary aggregate: currency and checkable deposits, the most spendable money.
- M2
- A broader aggregate equal to M1 plus near-money such as small time deposits and retail money market funds.
- M3
- A broad monetary aggregate equal to M2 plus large time deposits and institutional funds; no longer officially published in the US.
- currency
- Physical paper notes and coins held by the public.
- reserves
- Funds a bank holds rather than lends, kept as cash or on deposit at the central bank.
- money multiplier
- The maximum factor by which the banking system can expand deposits from an injection of reserves, equal to one divided by the reserve ratio.
- bank run
- A simultaneous rush of depositors to withdraw funds, which can collapse even a solvent fractional-reserve bank.
- Federal Reserve
- The central bank of the United States, responsible for monetary policy and financial stability.
- lender of last resort
- A central bank's role of lending to solvent banks during a panic to prevent collapse.
- monetary policy
- Central bank actions that adjust the money supply and interest rates to influence the macroeconomy.
- fiscal policy
- Government taxing and spending decisions used to influence the economy.
- open market operations
- Central bank purchases and sales of government bonds to change bank reserves and the money supply.
- Treasury
- The government department that collects taxes, pays bills, and issues government debt.
- quantity theory of money
- The theory that the price level is linked to the money supply through the equation of exchange, MV = PY.
- velocity
- The average number of times a unit of money is spent on final goods and services in a period.
- inflation
- A sustained rise in the general price level, which erodes the purchasing power of money.
- independent central bank
- A central bank insulated from direct political and private control, better able to resist pressure to over-issue money.
- full employment
- The level of employment at which cyclical unemployment is eliminated and only frictional and structural unemployment remain.
Discussion Questions
- PanOpticon tells Patsy that "whoever controls the printing press controls the scoreboard." Using the quantity theory of money and the idea of the inflation tax, explain mechanically how Logan Prime could enrich himself by controlling money creation — and who specifically bears the cost. Why does this require a population that cannot read the monetary aggregates?
- The Old Empire's arc moved from a stabilizing Centralized Banking Facility to a captured, over-centralized one under Logan. Drawing on the distinction between the Fed and the Treasury and on the case for central bank independence, argue whether the problem was centralization itself or the fusion of centralized power with private interest. What institutional wall would you rebuild first, and why?
- Patsy keeps a case of tangled wires and says she is "the person who can open the machine." If the "machine" is the monetary system, which single gauge — the level of an aggregate, its growth rate, its velocity, or the inflation rate it drives — would you teach the underclass to read first in order to most quickly expose Logan's hidden tax? Defend your choice with the economics from this lecture.
References
- (2017). The U.S. Money Supplies. https://learn.mru.org/courses/principles-of-macroeconomics/units/monetary-policy-and-the-federal-reserve/lessons/monetary-policy-federal-reserve-system-us-money-supplies
- (2017). The Money Multiplier. https://learn.mru.org/courses/principles-of-macroeconomics/units/monetary-policy-and-the-federal-reserve/lessons/federal-reserve-money-multiplier
- (n.d.). Our History. Bank of England. https://www.bankofengland.co.uk/about/history
- (2013). Federal Reserve Act Signed into Law. Federal Reserve History. https://www.federalreservehistory.org/essays/federal-reserve-act-signed
- (2013). Creation of the Bretton Woods System. Federal Reserve History. https://www.federalreservehistory.org/essays/bretton-woods-created
- (2013). Nixon Ends Convertibility of U.S. Dollars to Gold and Announces Wage/Price Controls. Federal Reserve History. https://www.federalreservehistory.org/essays/gold-convertibility-ends
- (2020). Money Stock Measures - H.6 Release - Technical Q&As. Federal Reserve Board, H.6 Release. https://www.federalreserve.gov/releases/h6/h6_technical_qa.htm
- (2026). M1 (M1SL). Federal Reserve Bank of St. Louis. https://fred.stlouisfed.org/series/M1SL
- (2026). Monetary Aggregates and Their Components: Broad Money and Components: M3 for United States (MABMM301USM189S). Federal Reserve Bank of St. Louis. https://fred.stlouisfed.org/series/MABMM301USM189S
- (2006). Discontinuance of M3. Federal Reserve Board, H.6 Release. https://www.federalreserve.gov/releases/h6/discm3.htm
- (2026). M2 [M2SL]. Federal Reserve Bank of St. Louis. https://fred.stlouisfed.org/series/M2SL
- (2020). Modern Principles: Macroeconomics. Worth Publishers
fed_rr_zero2020(not in references library)frb-reserve-requirements(not in references library)frb-balance-sheet-trends(not in references library)frb-2019-policy-implementation(not in references library)frb-iorb(not in references library)frb-on-rrp(not in references library)frb-open-market-operations(not in references library)frb-2022-balance-sheet-plans(not in references library)frb-policy-normalization(not in references library)frb-faq-currency-cost(not in references library)- (2026). Velocity of M2 Money Stock (M2V). Federal Reserve Bank of St. Louis. https://fred.stlouisfed.org/series/M2V
- (2026). Velocity of M1 Money Stock (M1V). Federal Reserve Bank of St. Louis. https://fred.stlouisfed.org/series/M1V